K-12 Teachers
Experience of LGBTQ+ Teachers
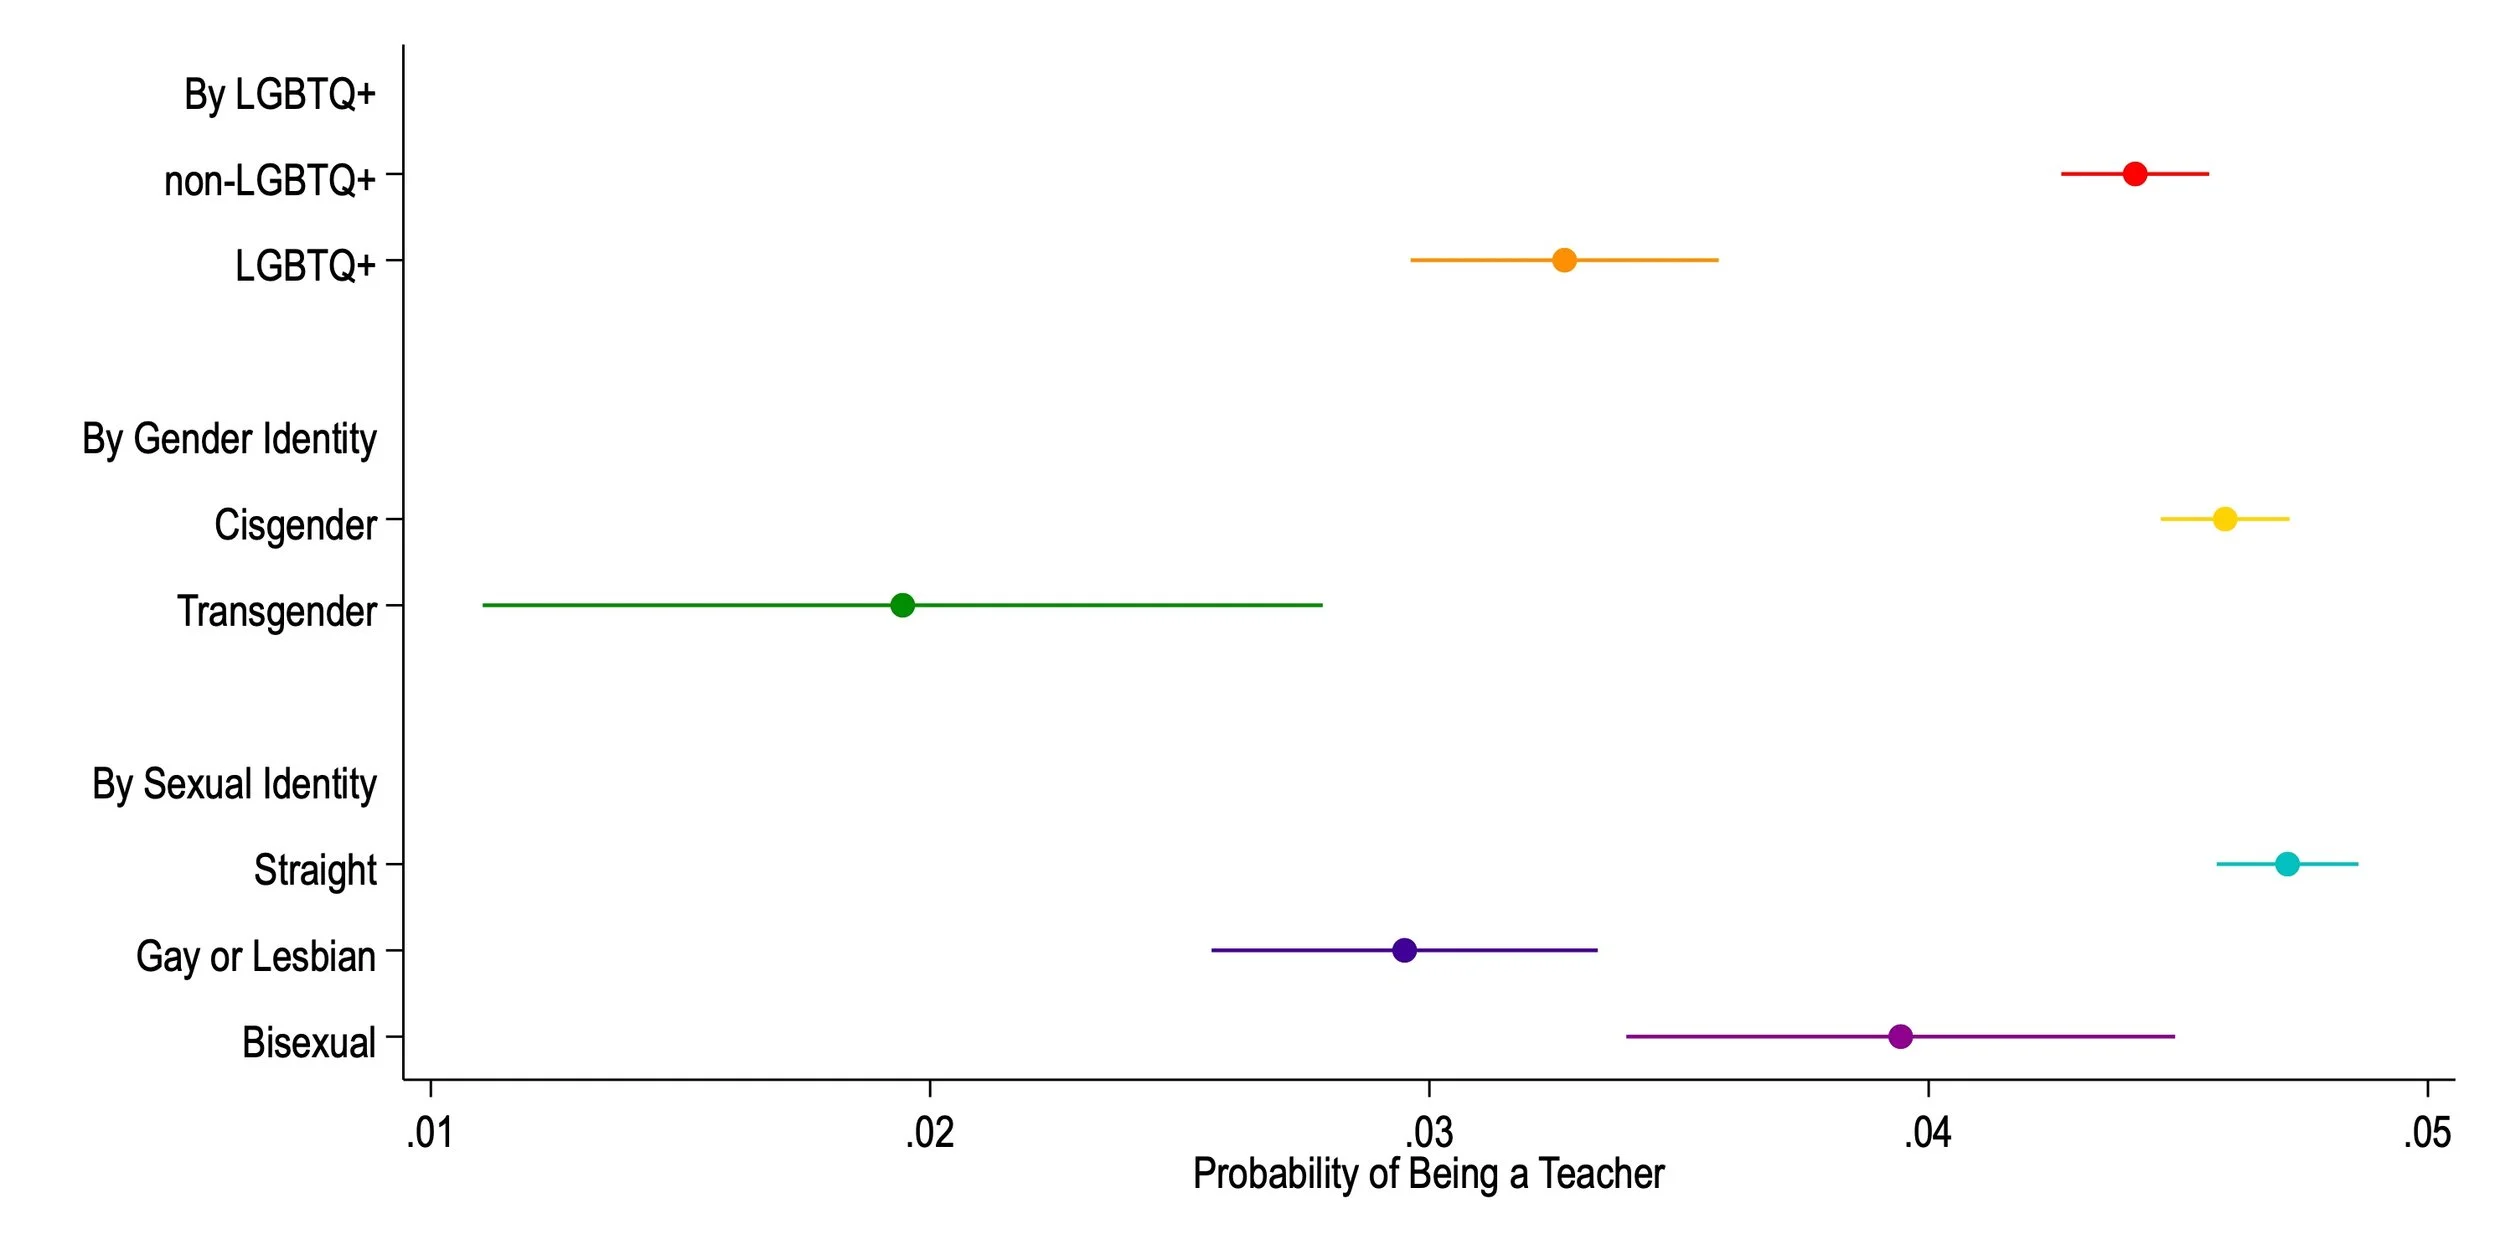
There are a lot of quantitative studies about teachers, including about how teachers’ demographic characteristics (gender, race/ethnicity) might impact the outcomes of matched students. There aren’t a lot of quantitative studies about LGBTQ+ teachers because LGBTQ+ status is not typically captured in state administrative records or on large national surveys. Using the American Community Survey (ACS) and Census Pulse, we examine the representation of LGBTQ+ individuals in PK-12 teaching. We find that 3.3-3.5% of LGBTQ+ individuals are teachers; in contrast, 4.4-4.9% of non-LGBTQ+ individuals are teachers. Although the publication is forthcoming, a preprint version is available here.

Evaluating K-12 Teacher Preparation Programs
With Jane Lincove, Cynthia Osborne, and Nick Mills, we find that, even though teachers from independent non-profits TPPs outperform teachers from other TPPs, these trainees teach only in very select areas of Texas (published in The Journal of Teacher Education).
With Paul von Hippel, Jane Lincove, Cynthia Osborne, and Nick Mills, we find that it is very difficult to distinguish between TPPs in Texas - differences are small, and estimates are noisy (published in Economics of Education Review). As shown below, few TPPs appear to be significantly different from the average when we correct for multiple testing, and the distribution of TPP effects very closely resembles the null distribution - the distribution of what estimates would look like under homogeneity (if estimates differed only due to random estimation error).
Paul von Hippel and I apply similar statistical techniques from our Texas study to previous studies in five other states. We find, like in Texas, that detectable differences between teachers from different TPPs are negligible (published in Economics of Education Review; article in Education Next; additional press coverage). We also release a Stata program (ssc install caterpillar) that allows users to replicate our methods, as well as easily calculate null distributions more generally.

In green are value-added estimates for every teacher preparation program in Texas, along with 95% confidence intervals for those estimates. In pink is the null distribution, or the pattern estimates should follow if programs were actually identical and ranked on estimation error alone.